Integrate Langfuse with Google's Agent Development Kit
This notebook demonstrates how to capture detailed traces from a Google Agent Development Kit (ADK) application with Langfuse using the OpenTelemetry (OTel) protocol.
Why Agent Development Kit?
Google’s Agent Development Kit streamlines building, orchestrating, and tracing generative-AI agents out of the box, letting you move from prototype to production far faster than wiring everything yourself.
Why Langfuse?
Langfuse gives you a detailed dashboard and rich analytics for every prompt, model response, and function call in your agent, making it easy to debug, evaluate, and iterate on LLM apps.
What this cookbook covers. We start with the simplest possible trace and add one concept at a time:
- A hello-world agent with a tool call (Example 1)
- Named, filterable traces with tags and metadata (Example 2)
- A multi-agent pipeline whose trace shows every sub-agent (Example 3)
- Attaching user-feedback scores to a trace (Example 4)
Step 1: Install dependencies
Note: google-adk 2.x requires Python ≥ 3.10. The "google-adk>=2" pin ensures pip installs the current ADK 2.x release instead of resolving to an older 1.x version to satisfy OpenTelemetry version constraints.
%pip install langfuse "google-adk>=2" openinference-instrumentation-google-adk -qStep 2: Set up environment variables
Fill in the Langfuse and your Gemini API key.
Note: the Gemini free tier has low per-model rate limits (per minute and per day). If a cell prints a 429/503 agent error, wait a moment and re-run it, temporarily switch the examples to a lighter model such as gemini-3.1-flash-lite, or use an API key with billing enabled.
import os

# Get keys for your project from the project settings page: https://cloud.langfuse.com
os.environ.setdefault("LANGFUSE_PUBLIC_KEY", "pk-lf-...");
os.environ.setdefault("LANGFUSE_SECRET_KEY", "sk-lf-...");
os.environ.setdefault("LANGFUSE_BASE_URL", "https://cloud.langfuse.com"); # 🇪🇺 EU region
# Other Langfuse data regions include 🇺🇸 US: https://us.cloud.langfuse.com, 🇯🇵 Japan: https://jp.cloud.langfuse.com and ⚕️ HIPAA: https://hipaa.cloud.langfuse.com

# Gemini API Key (Get from Google AI Studio: https://aistudio.google.com/app/apikey)
os.environ.setdefault("GOOGLE_API_KEY", "...");
With the environment variables set, we can now initialize the Langfuse client. get_client() initializes the Langfuse client using the credentials provided in the environment variables.
from langfuse import get_client

langfuse = get_client()

# Verify connection
if langfuse.auth_check():
    print("Langfuse client is authenticated and ready!")
else:
    print("Authentication failed. Please check your credentials and host.")
Langfuse client is authenticated and ready!
Step 3: OpenTelemetry Instrumentation
Use the GoogleADKInstrumentor library to wrap ADK calls and send OpenTelemetry spans to Langfuse.
from openinference.instrumentation.google_adk import GoogleADKInstrumentor

GoogleADKInstrumentor().instrument()
Step 4: Run examples
Example 1: Hello world agent with a tool call
The smallest possible setup: one agent, one tool. Every tool call and model completion is captured as an OpenTelemetry span and forwarded to Langfuse.
from google.adk.agents import Agent
from google.adk.runners import Runner
from google.adk.sessions import InMemorySessionService
from google.genai import types

def say_hello():
    return {"greeting": "Hello Langfuse 👋"}

agent = Agent(
    name="hello_agent",
    model="gemini-3.5-flash",
    instruction="Always greet using the say_hello tool.",
    tools=[say_hello],
)

APP_NAME = "hello_app"
USER_ID = "demo-user"
SESSION_ID = "demo-session"

session_service = InMemorySessionService()
# create_session is async → await it in notebooks
await session_service.create_session(app_name=APP_NAME, user_id=USER_ID, session_id=SESSION_ID)

runner = Runner(agent=agent, app_name=APP_NAME, session_service=session_service)

user_msg = types.Content(role="user", parts=[types.Part(text="hi")])
for event in runner.run(user_id=USER_ID, session_id=SESSION_ID, new_message=user_msg):
    if event.is_final_response():
        if event.content and event.content.parts:
            print(event.content.parts[0].text)
        elif event.error_message:
            print(f"Agent error: {event.error_message}")
Hello! Hello Langfuse 👋
Langfuse automatically maps the user_id and session_id you pass to runner.run() to the trace's user and session — you get user and session tracking without any extra code.
Example 2: Named and filterable traces
By default, traces are named after the ADK app (invocation [hello_app]). Use propagate_attributes to set a descriptive trace name, tags, and metadata so you can filter traces in Langfuse.
One thing to watch out for: the synchronous runner.run() executes the agent on a background worker thread, so OpenTelemetry context — and with it everything set via propagate_attributes — does not reach the ADK spans. Use the async runner.run_async() API instead, which runs in the current context:
from langfuse import propagate_attributes

SESSION_ID_2 = "demo-session-2"
await session_service.create_session(app_name=APP_NAME, user_id=USER_ID, session_id=SESSION_ID_2)

with propagate_attributes(
    trace_name="hello-agent-request",
    tags=["google-adk", "cookbook"],
    metadata={"example": "named-trace"},
):
    async for event in runner.run_async(user_id=USER_ID, session_id=SESSION_ID_2, new_message=user_msg):
        if event.is_final_response():
            if event.content and event.content.parts:
                print(event.content.parts[0].text)
            elif event.error_message:
                print(f"Agent error: {event.error_message}")
Hello Langfuse 👋
Example 3: Multi-agent pipeline with Workflow
Real ADK applications are rarely a single agent. ADK 2.x composes agents (and plain functions or tools) into an execution graph with Workflow — and the trace shows every node as its own span, with its own model calls, token usage, and cost.
Here a researcher agent stores its result in session state via output_key, and a writer agent reads it through the {research_notes} placeholder in its instruction. The edge chain ("START", researcher, writer) runs them sequentially:
from google.adk.workflow import Workflow

researcher = Agent(
    name="researcher",
    model="gemini-3.5-flash",
    instruction="Gather two short facts about the topic. Reply in two bullet points.",
    output_key="research_notes",  # stores the reply in session state
)
writer = Agent(
    name="writer",
    model="gemini-3.5-flash",
    instruction="Write a single friendly sentence summarizing: {research_notes}",
)
pipeline = Workflow(name="research_pipeline", edges=[("START", researcher, writer)])

PIPELINE_SESSION_ID = "pipeline-session"
await session_service.create_session(app_name=APP_NAME, user_id=USER_ID, session_id=PIPELINE_SESSION_ID)
pipeline_runner = Runner(agent=pipeline, app_name=APP_NAME, session_service=session_service)

topic = types.Content(role="user", parts=[types.Part(text="The Langfuse platform")])
with propagate_attributes(trace_name="research-pipeline", tags=["google-adk", "multi-agent"]):
    async for event in pipeline_runner.run_async(user_id=USER_ID, session_id=PIPELINE_SESSION_ID, new_message=topic):
        if event.is_final_response() and event.content and event.content.parts:
            print(f"[{event.author}]", event.content.parts[0].text)
[researcher] * Langfuse is an open-source LLM (Large Language Model) engineering platform designed for tracing, debugging, and monitoring AI applications.
- It provides features for prompt management, tracking API costs and latency, and evaluating the quality of LLM outputs using both automated and manual methods. [writer] Langfuse is a wonderful open-source LLM engineering platform that helps you easily monitor, debug, and optimize your AI applications by tracking costs, managing prompts, and evaluating output quality all in one place!
The trace now contains one agent_run span per pipeline stage, each with its own generation.
For dynamic delegation, LLM agents can alternatively coordinate sub_agents themselves — the spans nest the same way.
Example 4: Score traces with user feedback
Scores attach evaluations — user feedback, guardrail results, eval outcomes — to a trace. To score an ADK run, create the trace ID upfront, run the agent inside an enclosing Langfuse span that uses this trace ID, and pass the same ID to create_score:
from langfuse import Langfuse

predefined_trace_id = Langfuse.create_trace_id()

SCORED_SESSION_ID = "scored-session"
await session_service.create_session(app_name=APP_NAME, user_id=USER_ID, session_id=SCORED_SESSION_ID)

final_response = None
with langfuse.start_as_current_observation(
    as_type="span",
    name="adk-request",
    trace_context={"trace_id": predefined_trace_id},
) as span:
    span.update(input="hi")
    async for event in runner.run_async(user_id=USER_ID, session_id=SCORED_SESSION_ID, new_message=user_msg):
        if event.is_final_response() and event.content and event.content.parts:
            final_response = event.content.parts[0].text
            print(final_response)
            span.update(output=final_response)

# e.g. triggered by a thumbs-up in your application
if final_response is not None:
    langfuse.create_score(
        trace_id=predefined_trace_id,
        name="user-feedback",
        value=1,
        data_type="NUMERIC",
        comment="The answer was helpful.",
    )
Hello Langfuse 👋
Step 5: View the traces in Langfuse
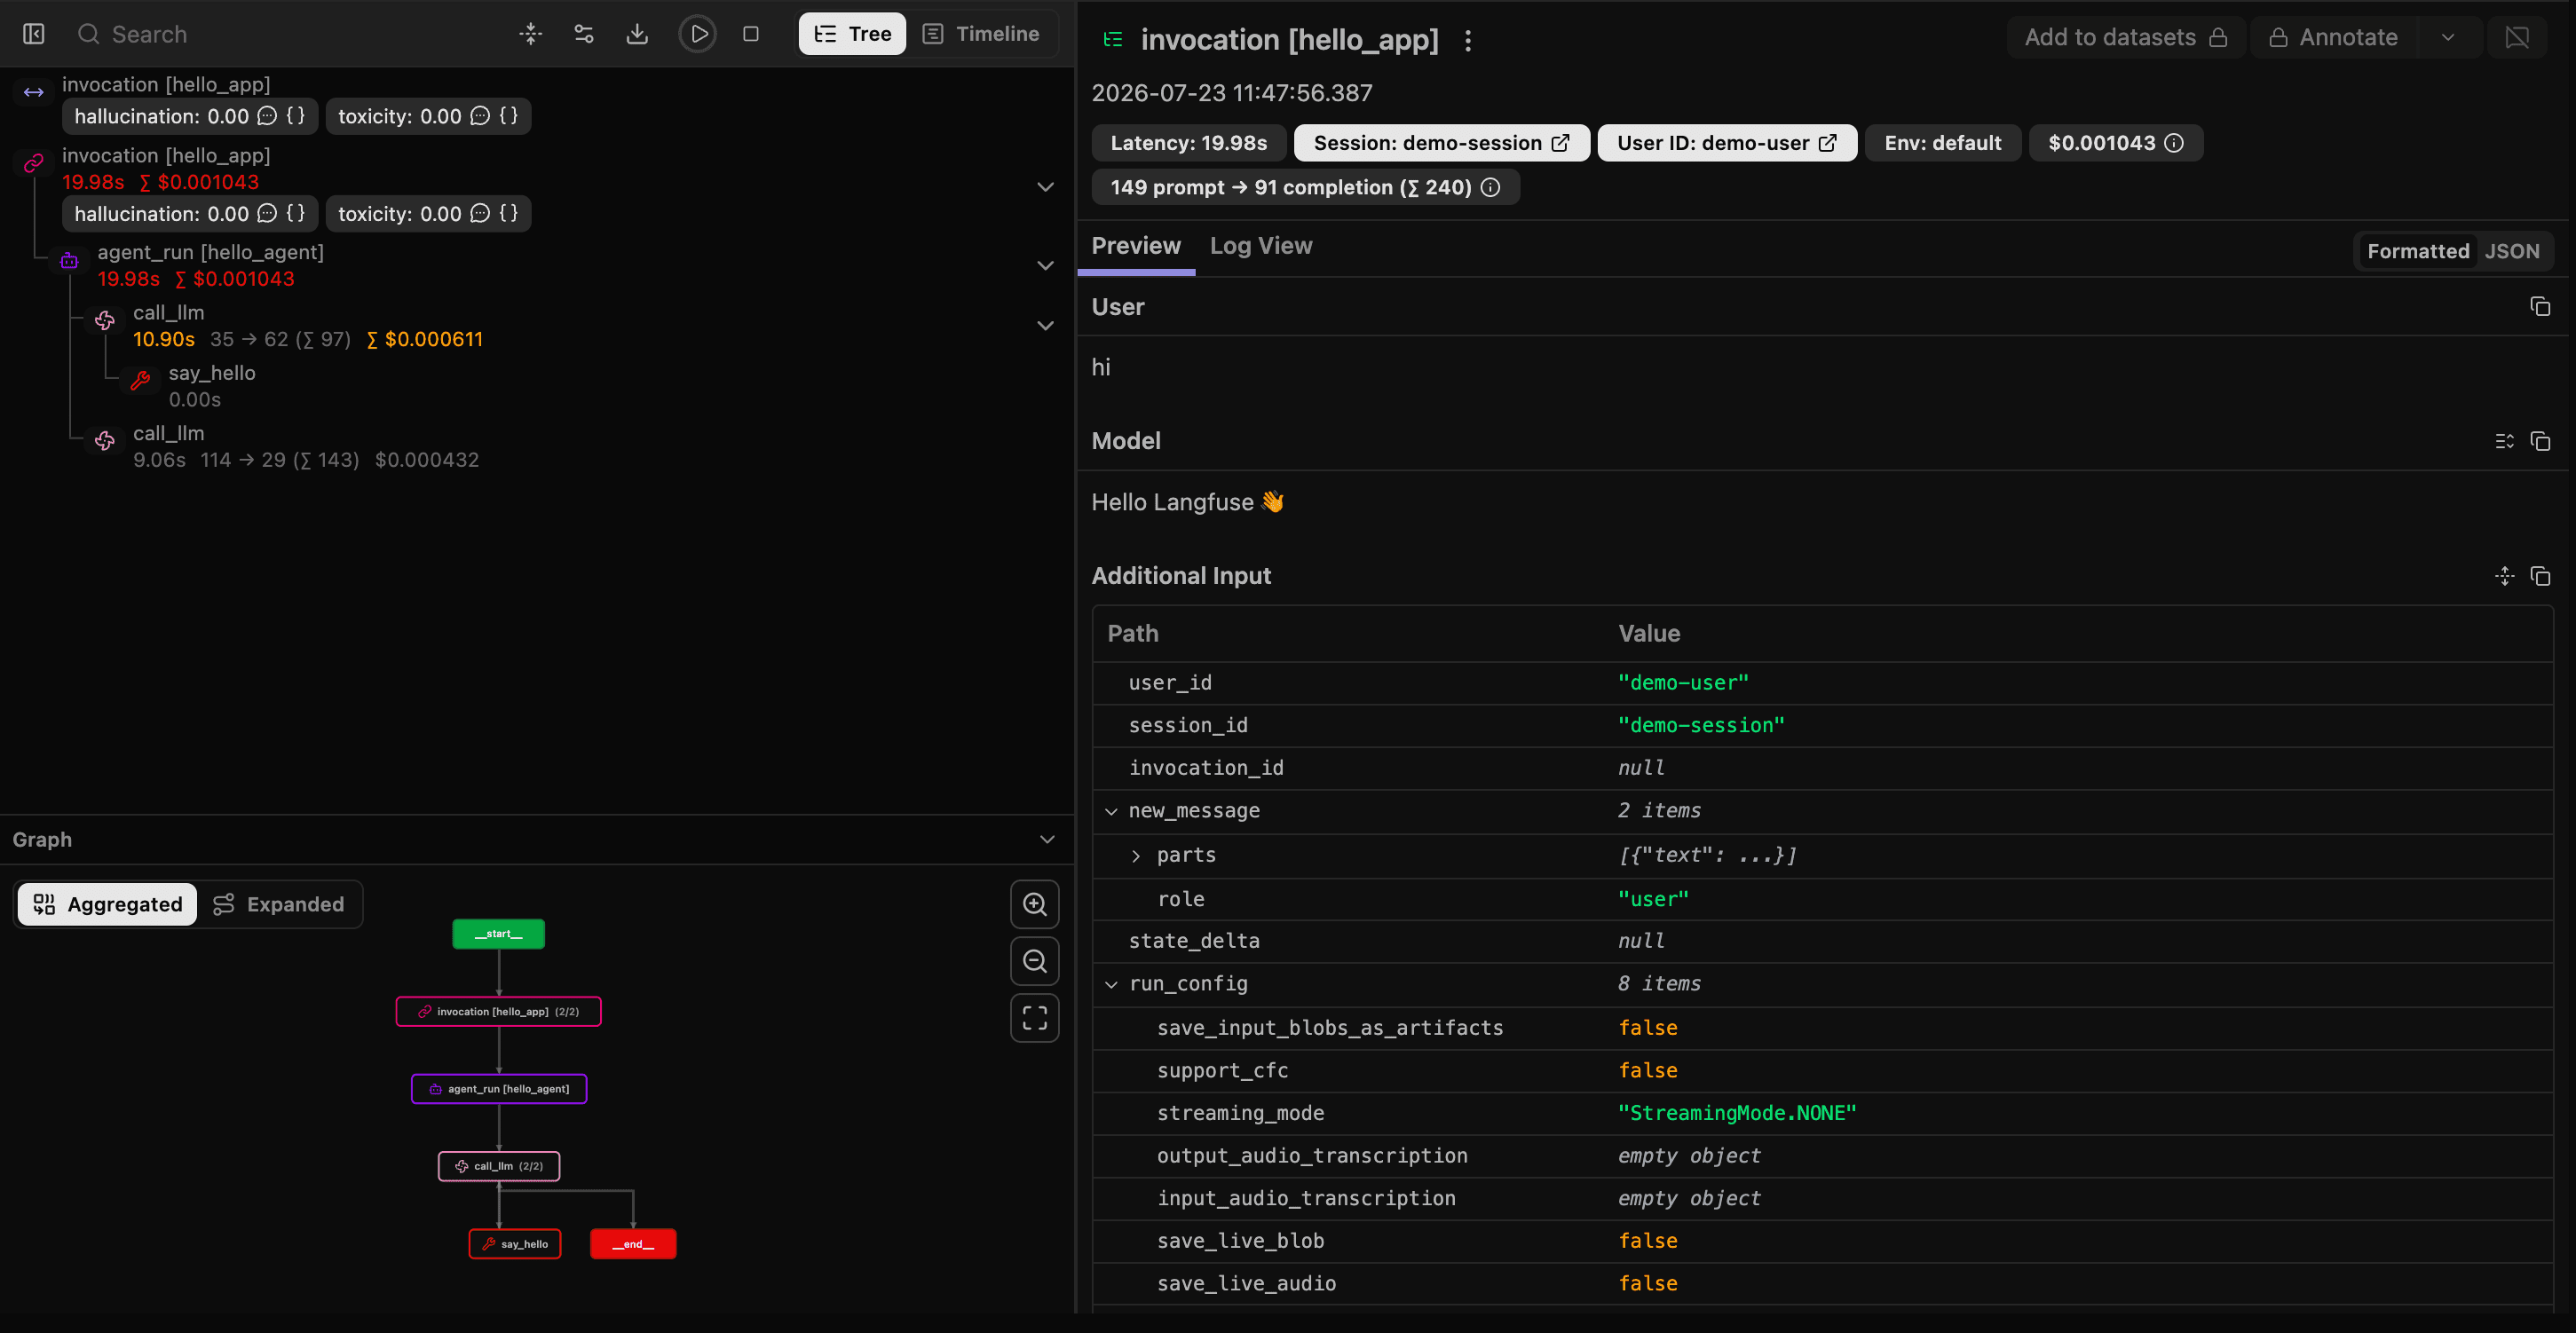
Head over to your Langfuse dashboard → Traces. Example 1 produces a trace with the agent loop and the tool call; Examples 2–4 add trace names, tags, nested sub-agents, and a user-feedback score. Traces are filterable by the users, sessions, and tags set above.
Interoperability with the Python SDK
You can use this integration together with the Langfuse SDKs to add additional attributes to the observation.
The @observe() decorator provides a convenient way to automatically wrap your instrumented code and add additional attributes to the observation.
from langfuse import observe, propagate_attributes, get_client

langfuse = get_client()

@observe()
def my_llm_pipeline(input):
    # Add additional attributes (user_id, session_id, metadata, version, tags) to all spans created within this execution scope
    with propagate_attributes(
        user_id="user_123",
        session_id="session_abc",
        tags=["agent", "my-observation"],
        metadata={"email": "user@langfuse.com"},
        version="1.0.0"
    ):

        # YOUR APPLICATION CODE HERE
        result = call_llm(input)

        return result

# Run the function
my_llm_pipeline("Hi")
Learn more about using the Decorator in the Langfuse SDK instrumentation docs.
The Context Manager allows you to wrap your instrumented code using context managers (with with statements), which allows you to add additional attributes to the observation.
from langfuse import get_client, propagate_attributes

langfuse = get_client()

with langfuse.start_as_current_observation(
    as_type="span",
    name="my-observation",
    trace_context={"trace_id": "abcdef1234567890abcdef1234567890"},  # Must be 32 hex chars
) as observation:

    # Add additional attributes (user_id, session_id, metadata, version, tags)
    # to all observations created within this execution scope
    with propagate_attributes(
        user_id="user_123",
        session_id="session_abc",
        metadata={"experiment": "variant_a", "env": "prod"},
        version="1.0",
    ):
        # YOUR APPLICATION CODE HERE
        result = call_llm("some input")

# Flush events in short-lived applications
langfuse.flush()
Learn more about using the Context Manager in the Langfuse SDK instrumentation docs.
Troubleshooting
No observations appearing
First, enable debug mode in the Python SDK:
export LANGFUSE_DEBUG="True"Then run your application and check the debug logs:
- OTel observations appear in the logs: Your application is instrumented correctly but observations are not reaching Langfuse. To resolve this:
- Call
langfuse.flush()at the end of your application to ensure all observations are exported. - Verify that you are using the correct API keys and base URL.
- Call
- No OTel spans in the logs: Your application is not instrumented correctly. Make sure the instrumentation runs before your application code.
Unwanted observations in Langfuse
The Langfuse SDK is based on OpenTelemetry. Other libraries in your application may emit OTel spans that are not relevant to you. These still count toward your billable units, so you should filter them out. See Unwanted spans in Langfuse for details.
Missing attributes
Some attributes may be stored in the metadata object of the observation rather than being mapped to the Langfuse data model. If a mapping or integration does not work as expected, please raise an issue on GitHub.
Next Steps
Once you have instrumented your code, you can manage, evaluate and debug your application:
Manage prompts in Langfuse
Add evaluation scores
Run LLM-as-a-judge Evaluators
Create datasets
Create custom dashboards
Test queries in the Playground
Last edited


